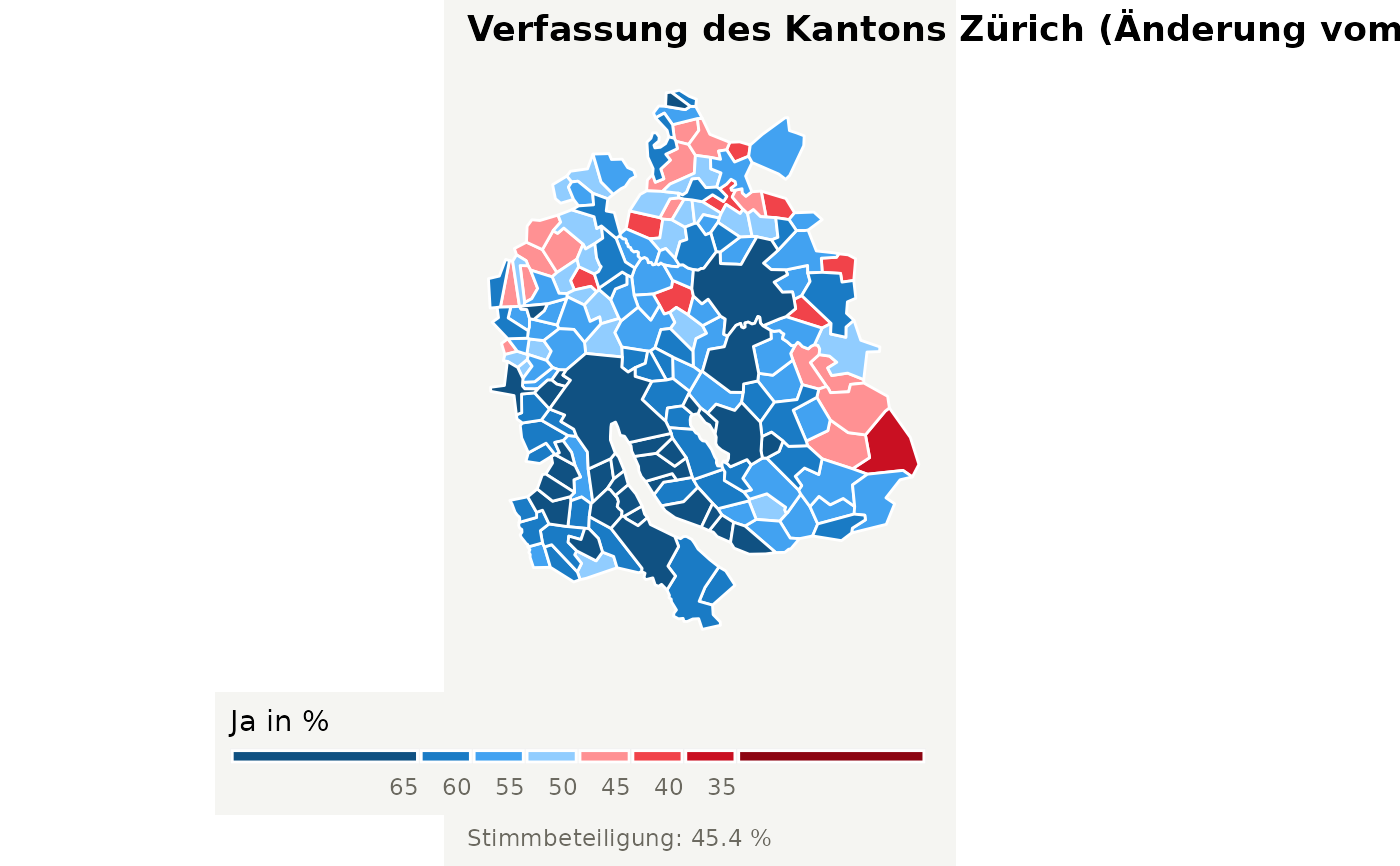
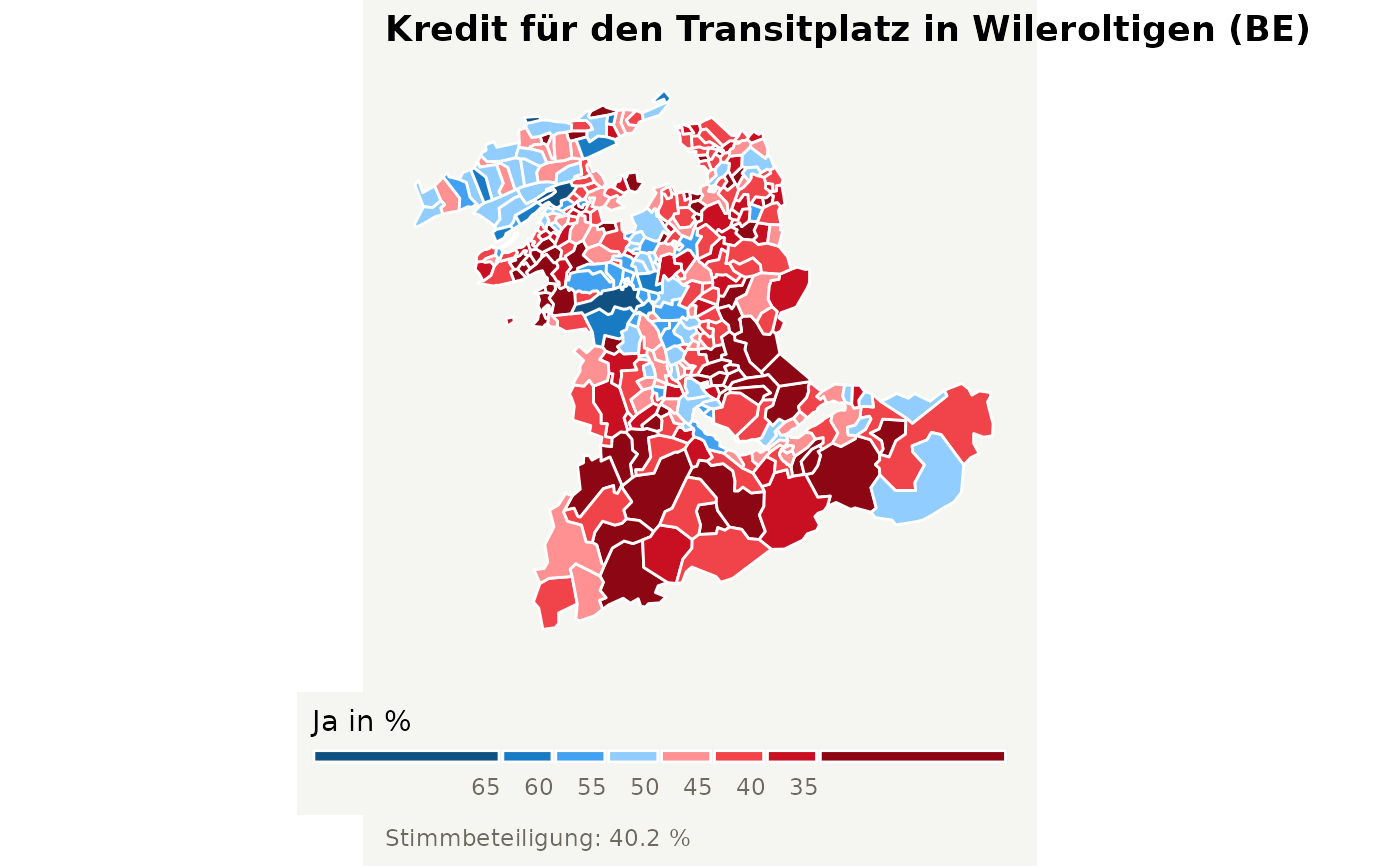
plot_cantonalvotes plots the results of cantonal votes in a choropleth map using ggplot2.
Usage
plot_cantonalvotes(
  votedate = NULL,
  vote_id = NULL,
  geolevel = "municipality",
  measure = "result",
  standardize = T,
  language = "DE",
  theme = "srf"
)
Arguments
- votedate
date of the ballot. Default: most recent ballot available.
- vote_id
id of the vote. Default: first id mentioned in the data set.
- geolevel
geographical level. Options: district", "municipality" or "zh_counting_districts".
- measure
measure to color the administrative units. Options: "result" for the yes vote share or "turnout" for the voter turnout of a given vote.
- standardize
if
TRUE, the scale of the measure ranges from 0 to 100 percent. Recommended for comparisons between votes.- language
defines the language. Options: "DE" for German, "FR" for French, "IT" for Italian or "RM" for Romansh.
- theme
defines basic appearance of the map. Five options are available: "srf" for a theme inspired by the plots of Swiss Radio and Television, and "A" to "E" for the viridis color scales magma, inferno, plasma, viridis and cividis.